I’m excited to announce plotly 4.9.0 is now on CRAN! Go ahead and upgrade via:
install.packages("plotly")
This release is about 8 months in the making and includes many bug fixes, some new features, and a couple slightly breaking changes. Over this time, I’ve mainly focused on getting a first draft of my new book, https://plotly-r.com, and some of these additions to plotly are in support of that new content. This post highlights the most important release features, but I highly recommend going over the full release report as well.
New shiny events
This release exposes a handful of new plotly events in shiny. See here for the full list of new events, this section of my book to learn about how to leverage plotly events in shiny, and my RStudio webinar for a tutorial on how to create responsive and scalable crossfiltering applications with these new events (like in the video below).
Also, see the advanced applications section of the plotly book for some new drill down examples.
New version of plotly.js
This new version of the R package upgrades the underlying plotly.js library from v1.42.3 to v1.46.1. This includes many bug fixes and new features, some of which I don’t mention here or in the R package’s NEWS, but you can see plotly.js’ release page for more info. That being said, here’s a breakdown of the most important items:
New trace types
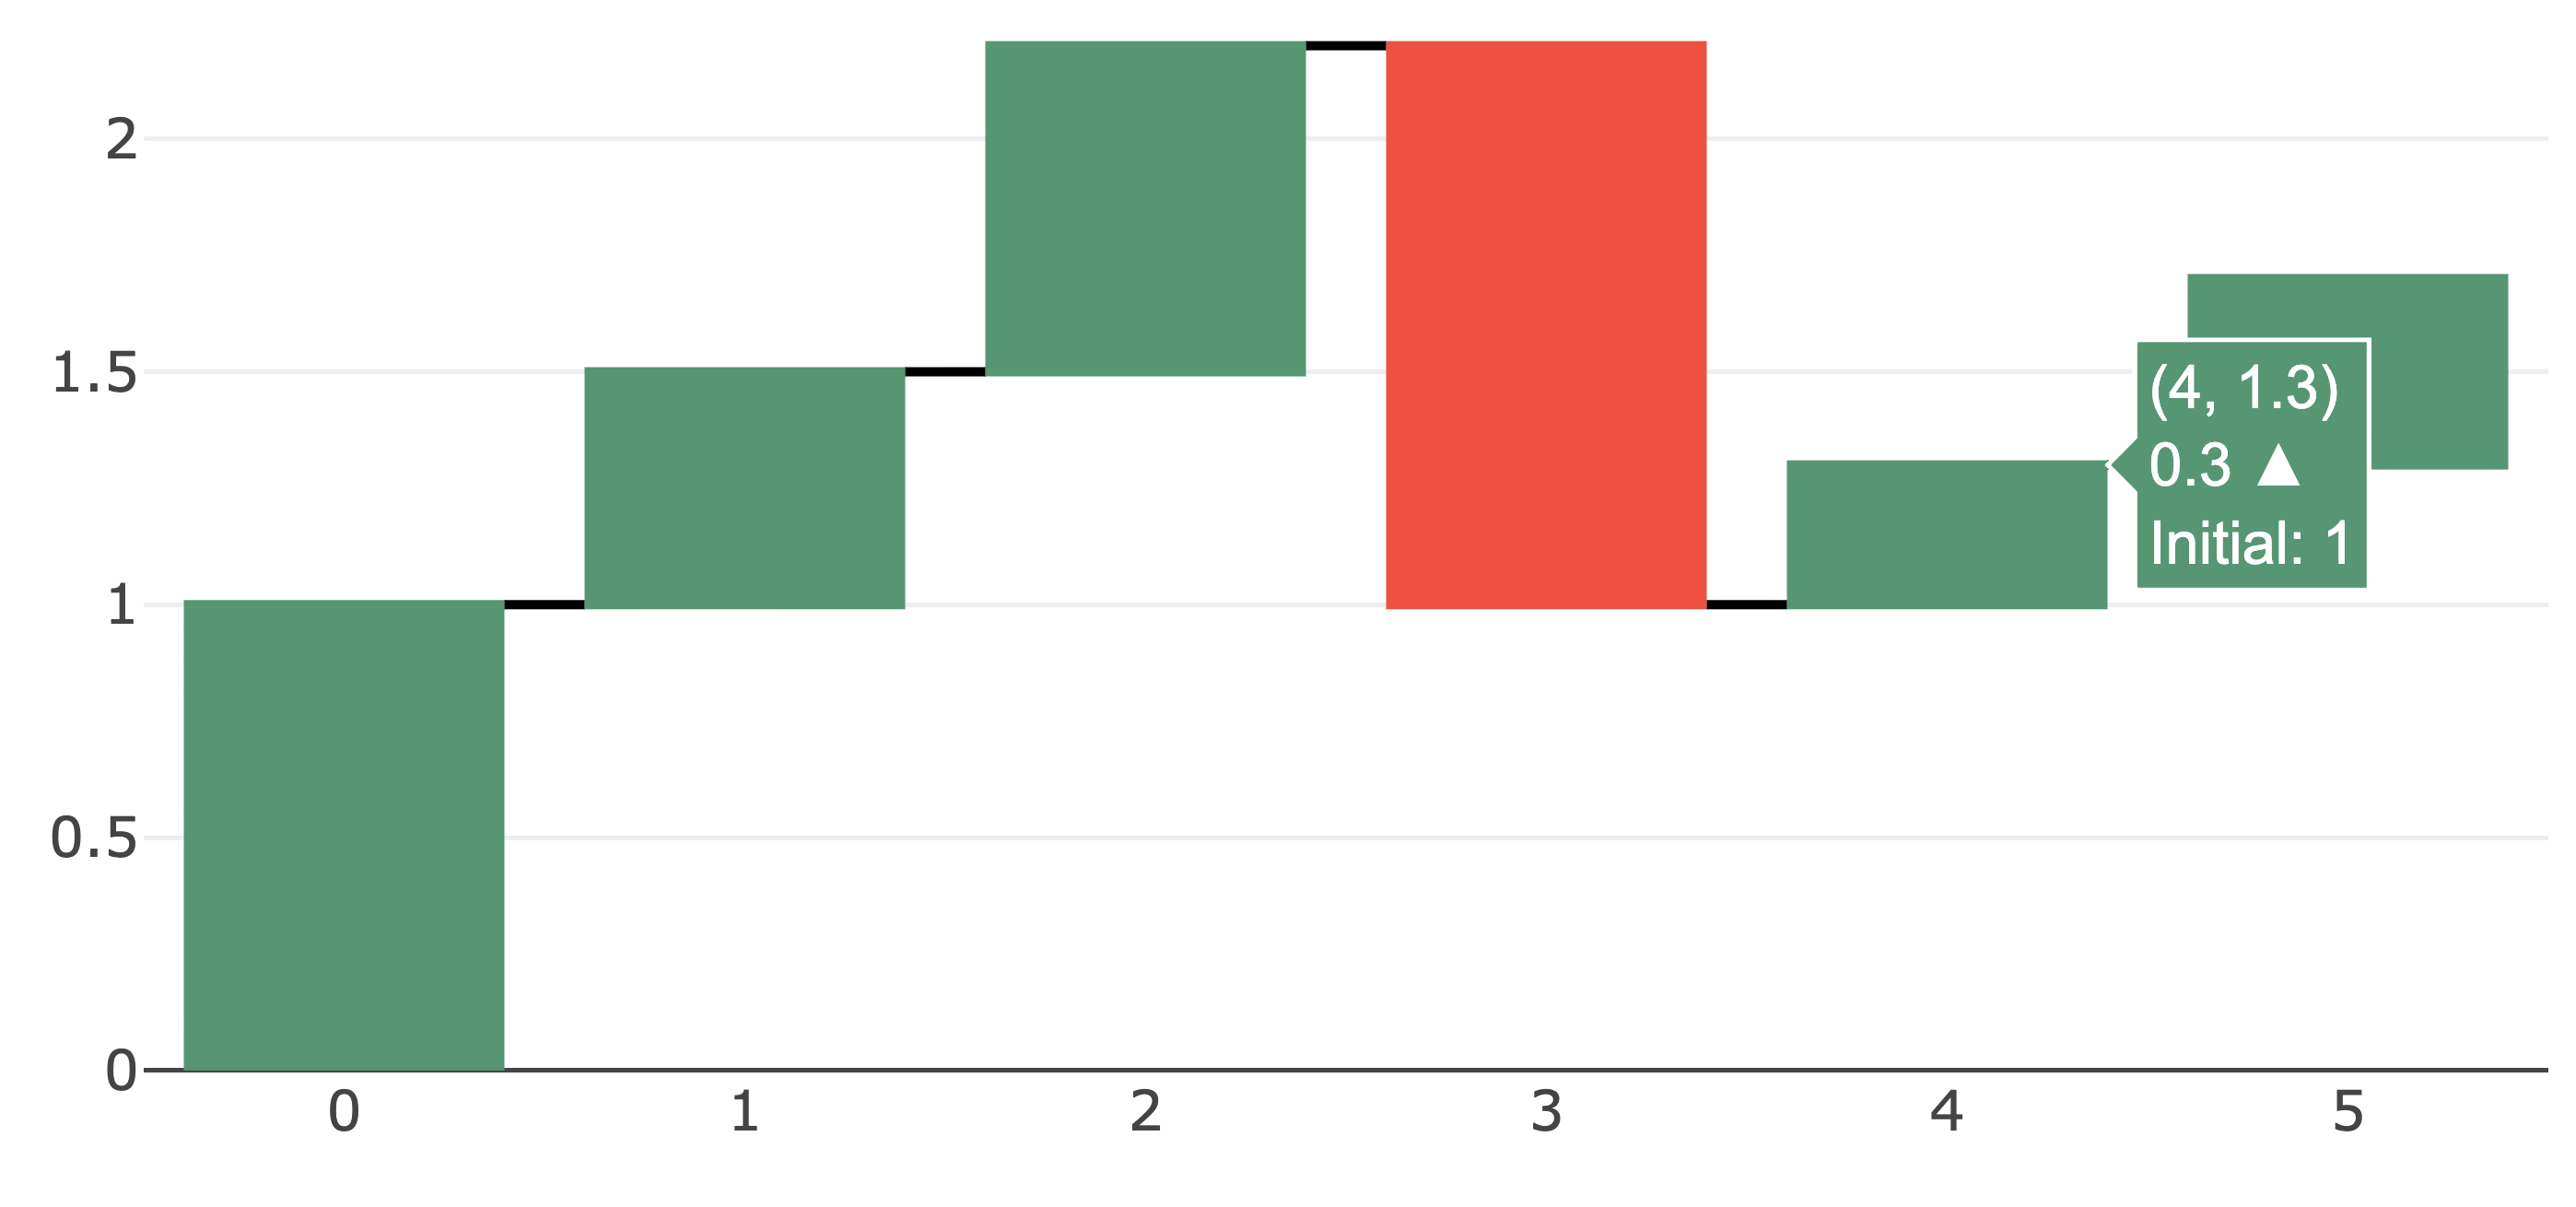
This release includes 3 new trace types: isosurface, sunburst, and waterfall. To get idea of what possible, you can search the plotly.js tests via https://rreusser.github.io/plotly-mock-viewer (the corresponding JSON source behind these example can be found here).
- Isosurface
- Sunburst
- Waterfall
plot_ly() %>%
  add_trace(
    type = "waterfall",
    x = c(0, 1, 2, 3, 4, 5),
    y = c(1, 0.5, 0.7, -1.2, 0.3, 0.4)
  )
I suspect soon https://plot.ly/r will have more R examples of these traces, but for now you can see some examples here
https://github.com/ropensci/plotly/blob/master/tests/testthat/test-plotly-isosurface.R https://github.com/ropensci/plotly/blob/master/tests/testthat/test-plotly-sunburst.R https://github.com/ropensci/plotly/blob/master/tests/testthat/test-plotly-waterfall.R
New hovertemplate attribute
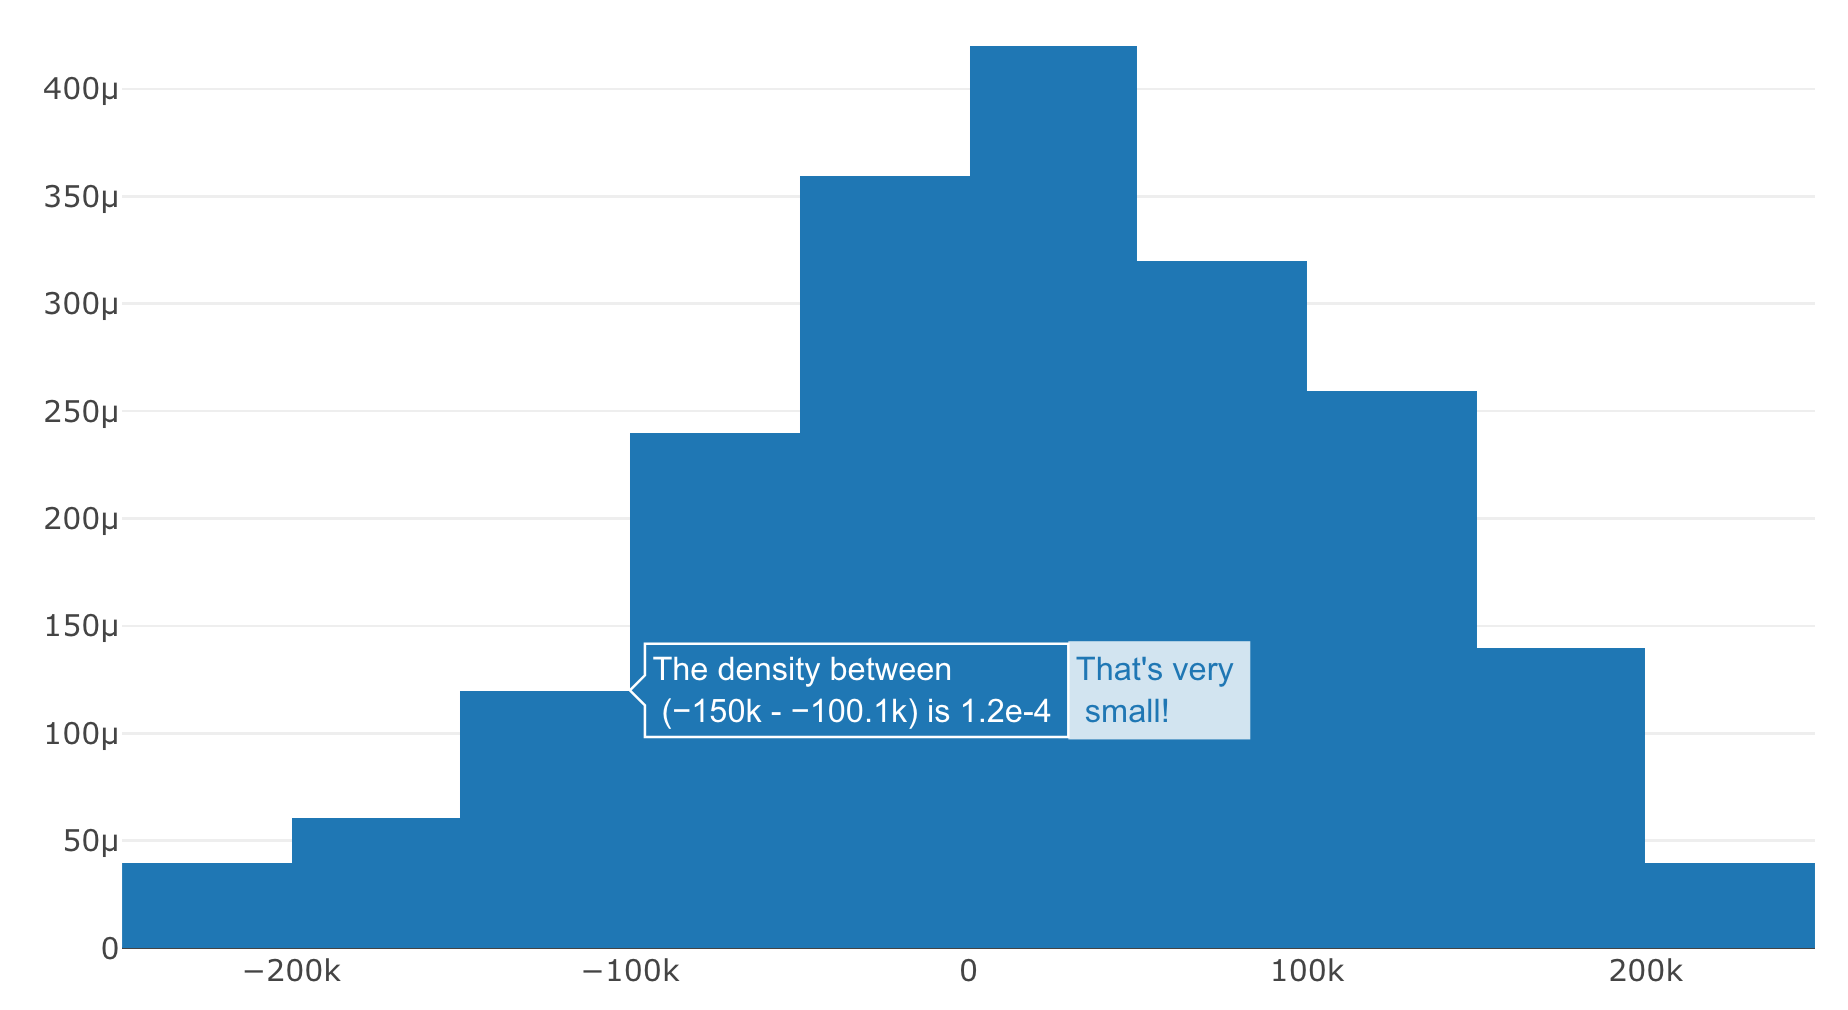
One of the more difficult things about plotly and plotly.js is about the various ways to control tooltips. This new special topic in my book attempts to cover all these approaches, as well as the new hovertemplate approach. This new attribute allows you to reference supplied (e.g., x in the Figure below) or computed variables in the tooltip (e.g., y in the Figure below). It also allows you to control the formatting (using d3-format’s syntax %{variable:d3-format}) and the <extra> bit of the tooltip that usually displays the trace name.
plot_ly(x = rnorm(100, 0, 1e5)) %>%
    add_histogram(
        histnorm = "density",
        hovertemplate = "The density between <br> (%{x}) is %{y:.1e} <extra>That's very <br> small!</extra>"
    )
New title API
Previously plot title’s were created by providing a string to layout.title. This will continue to work, but layout.title now accepts a list object, which adds the ability to move the title’s location.
library(plotly)
plot_ly(x = 1, y = 1) %>%
  layout(title =
    list(
      text = "My title",
      x = 1,
      font = list(
        family = "Roboto",
        color = "#1E86FF",
        size = 18
      )
    )
  )

Since plotly.js now supports this feature, ggplotly() will now automatically pick up on the title alignment
library(plotly)
p <- qplot(1:10) +
  ggtitle("My amazing plot!") +
  theme(
    plot.title = element_text(
      family = "Roboto",
      color = "red",
      size = 16
    )
  )
ggplotly(p)
